


Quick Links
Infographics are renowned in the SEO world for their ability to simultaneously educate and entertain audiences.
Whether you want to share a group of statistics or need to teach your audience how to do something, infographics are an extremely diverse content medium that can convey just about anything.
They’re excellent for breaking up long walls of text, and they add extra visual appeal to your posts (which will boost user engagement).
In fact, research shows that infographics boost website traffic by 12%, and they’re 30 times more likely to be read than a written article.
However, today we’re going to discuss one of the major reasons why SEOs love infographics – which is their effectiveness at generating organic backlinks.
Infographic link-building is where you create alluring infographics with the goal of generating as many backlinks as possible.
These links are especially valuable because they’re generated entirely on merit instead of outreach efforts (which is what Google prefers, anyway).
If you’ve conducted a link-building campaign before, you’ll know that organically generated backlinks are very hard to acquire, which is why infographics are so powerful.
In this article, we’ll cover:
- Why you should use infographics
- The different types of infographics
- How to create an infographic step-by-step
- Link-building techniques for infographics
There’s a lot to unpack here, so stay tuned to learn more.
What Are Infographic Links?
Have you ever found a video or image online that was so good you had to share it with friends or post it on your own site?
That’s the principle behind creating infographics to acquire backlinks.
What’s an infographic link?
It’s where another website embeds your infographic on their website, in turn linking back to your website as the source.
They get to share your awesome infographic, and you pick up a backlink to improve your search engine rankings.
Whenever an infographic is particularly compelling or useful, it has the potential to generate hundreds of backlinks from relevant websites. The key is to create an infographic that touches on something particularly important to your target audience.
That’s why statistical infographics are among the most popular, which are infographics that list statistics in a visually compelling way. Bloggers, copywriters, and content creators are constantly on the hunt for accurate statistics to use.
Instead of using a boring hyperlink to a study or research paper, content creators prefer to capitalize on the visual magic provided by infographics. That’s why statistical infographics have the potential to generate backlinks like mad.
Here’s a brief breakdown of the infographic link process:
- Create an infographic that’s A) visually pleasing and B) contains valuable (and sought after) information for your target audience.
- Generate a code snippet that lets other websites embed your infographics into their content.
- Gain backlinks.
Why Use Infographics For Your Link-Building Campaign
Conducting cold outreach is infamous for being one of the most difficult aspects of link-building (and SEO in general).
Generic pitches that lack personalization to individual website owners are unlikely to stand out from the crowd from the plethora of pitches site owners receive each day.
Even if you provide a unique, stand-out pitch – there’s still no guarantee that it will lead to a backlink.
This is the main reason why it’s worth using infographics for your link-building campaign, as virtually no outreach is required.
At the same time, many businesses and site owners lack the know-how or internal resources to create high-value infographics. Therefore, if you are able to produce infographics, you’ll cut out a majority of the competition you’re dealing with on the cold outreach front.
Besides that, visually appealing, informative infographics are:
- Highly shareable on social media platforms (which means more referral traffic)
- Naturally attract backlinks
- Boost your SEO efforts (backlinks, referral traffic, brand awareness, etc.)
You can also use infographics to bolster your outreach efforts. Instead of asking for a guest post or a link insertion, why not craft a pitch asking a site owner to share your infographic? After all, if it’s a truly valuable infographic, the site owner will benefit from hosting it on their site via more traffic.
But how do you create infographics that generate backlinks?
Today, we’re going to dive into the specific techniques SEO professionals use to craft engaging infographics and personalized outreach pitches to secure high-value backlinks.
Let’s get to it!
Types of Infographics That You Can Use
As stated before, infographics are an incredibly diverse content medium.
There are countless styles and formats you can use depending on your needs, so you’re bound to find the type that’s perfect for your next project.
Let’s take a look at the most common types of infographics.
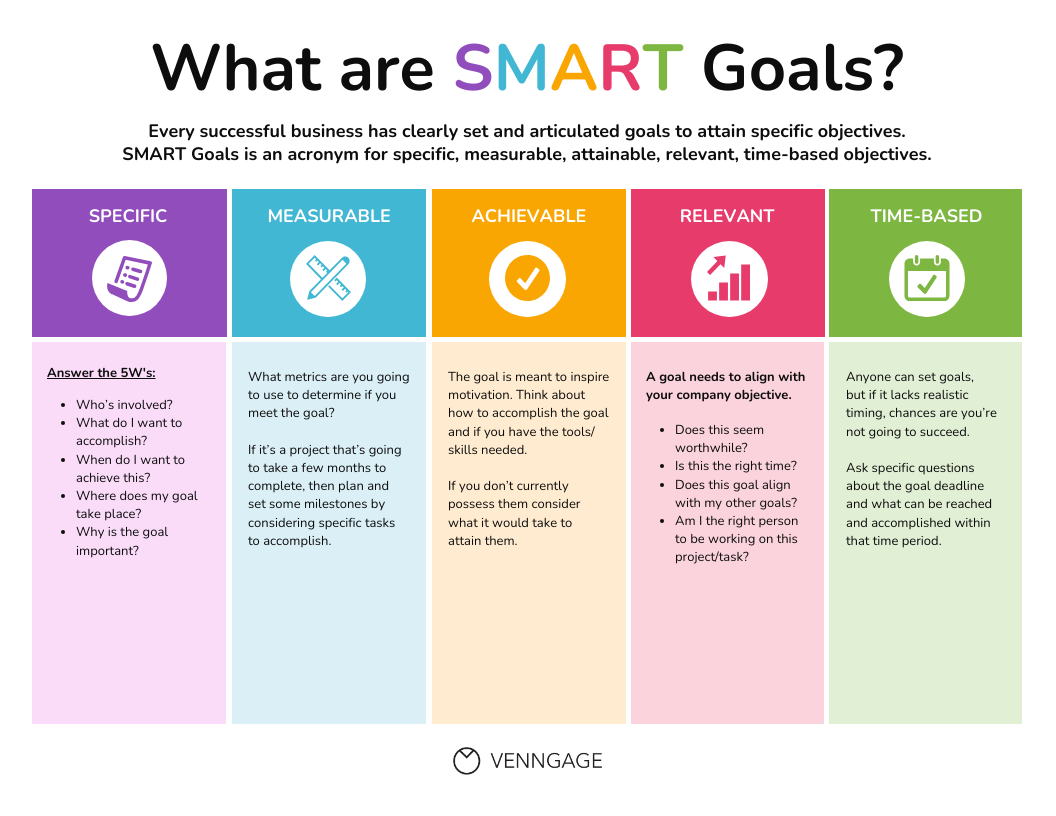
Informational Infographics
An informational infographic is a visual representation of data designed to educate or inform the viewer on a specific topic.
It typically includes graphics, charts, and other data visualizations to simplify complex information into small, digestible bites.
You should create an informational infographic if you have complicated information you need to communicate to your audience. It could be that you need to explain a topic, dispel common myths, or inform readers of new developments.
While your goal is to inform, remember that infographics are a visual medium. Do your best to keep text sparse while using plenty of engaging graphics in between.
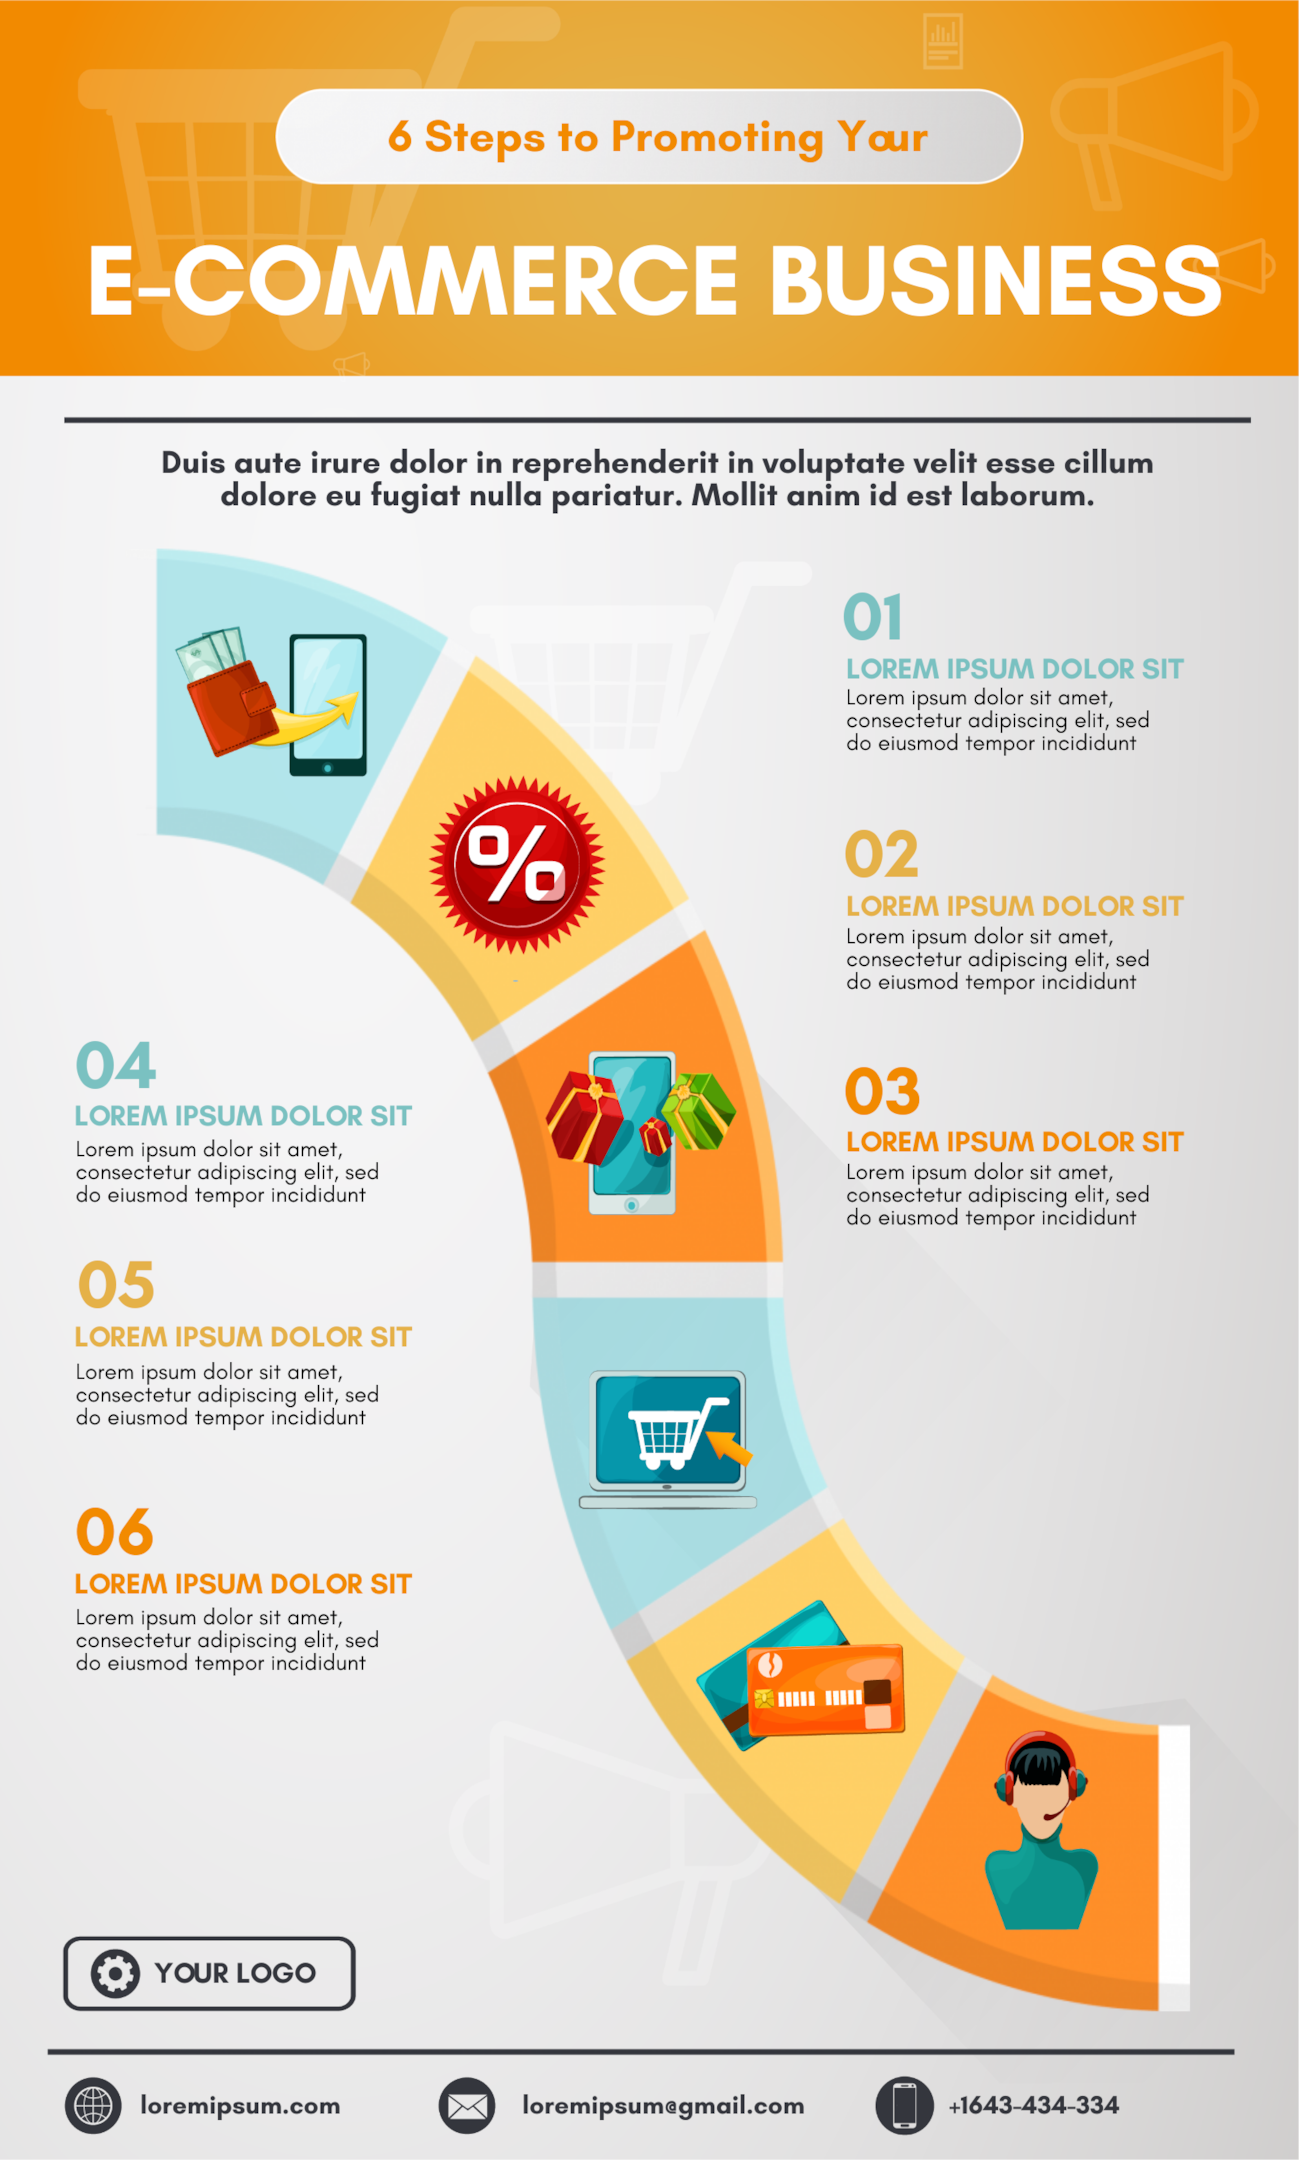
Process Infographics
Do you need to teach your audience how to complete a specific process?
If so, then a process infographic is what you need. It’s a visual representation of a process broken down into individual steps. These infographics make heavy use of arrows, icons, and other graphics that help guide the reader’s eyes through the various steps of the process.
You can think of a process infographic like an assembly line in a factory.
This style of infographic is popular for instructional materials, user guides, and workflow diagrams. Process infographics are also highly shareable since they teach users how to do something. As long as your infographic covers a process that your audience cares about, you should start raking in backlinks.
List Infographics
List infographics visually represent information by presenting it in a list format. Statistical infographics are list infographics, and so are infographics that provide tips or features of a product.
You can also use list infographics to provide readers with certain materials they’ll need for a project (like construction materials for a home renovation).
These types of infographics are easy for readers to scan, which is why they’re so popular. According to the NN Group, 79% of people scan web pages first, with only 16% opting to read something word-for-word.
That means concise list infographics will appeal to scanners, which are the majority of online users.
Hierarchical Infographics
As the name implies, a hierarchical infographic follows a visual hierarchy – with the most important/overarching concepts appearing at the top and more detailed/less important concepts branching out from there.
You should opt for a hierarchical infographic if you need to present interconnected or overarching ideas, like the structure of an organization or a particular decision-making process.
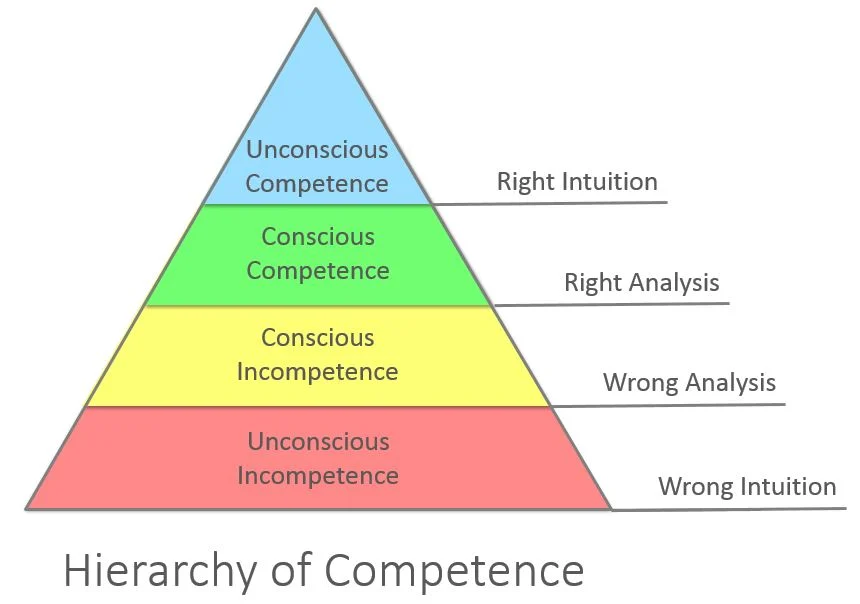
9 times out of 10, a hierarchical infographic will take the form of a pyramid, with visually engaging colors, icons, and headings.
How to Create a Compelling Infographic
It’s worth investing time and effort into crafting your infographics, as subpar offerings won’t cut it.
Your audience will only link to your infographics if they’re truly engaging and contain valuable information.
An example would be creating an infographic breaking down the components of a guitar (head, neck, body, etc.) to appeal to beginner guitarists.
Let’s take a look at what it takes to create an engaging infographic that attracts shares.
Step 1: Determine your objective
Ask yourself, what’s the purpose of this infographic?
In other words, do you want to inform, educate, or promote a specific product/service? Answering this question will inform the rest of your infographic’s design, so you should address it first.
Regardless of your objective, you need to make sure your infographic content is unique.
One of the best ways to ensure your content is 100% original is to take a look at other infographics covering the same topic (if there are any, that is).
Take notes about what they cover the most, including any key points that they leave out. That way, you’ll know what to include and what to avoid whenever you create your infographic.
Also, people hate reading because it takes work and brain power. The human brain prefers pretty pictures over long, tedious walls of text.
To get ideas on what type of infographic you should create, I recommend using Pinterest to find infographics that are already popular in your niche:
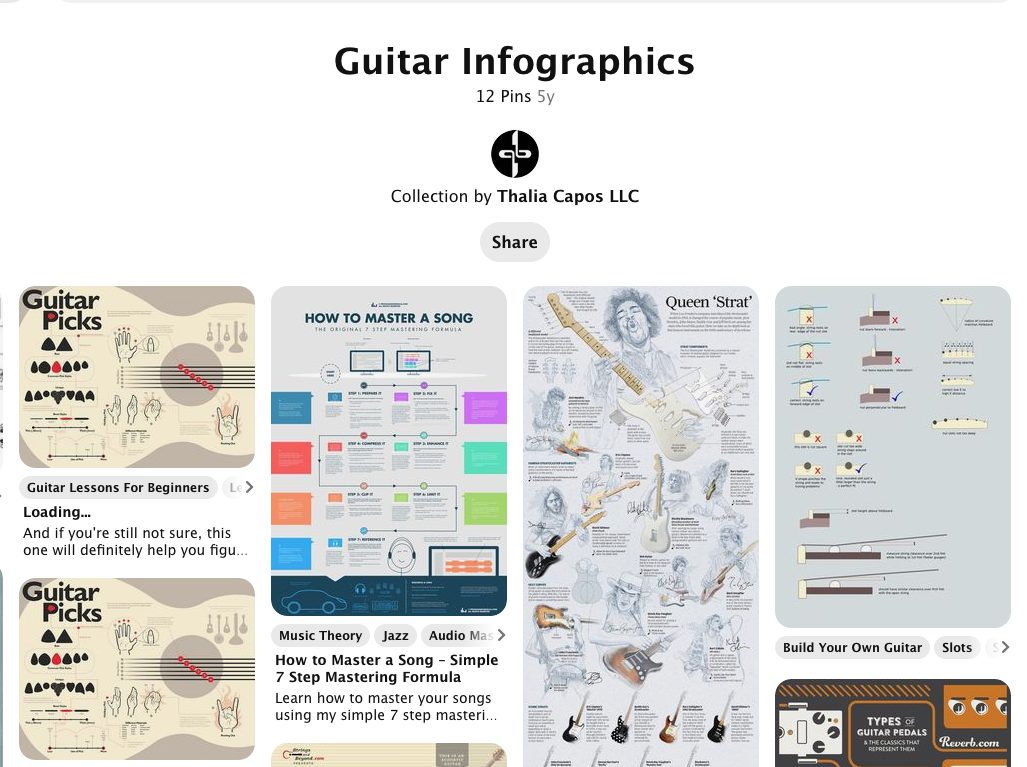
For example, if I do a search for “marketing infographics,” Pinterest will show me results that boast heavy engagement numbers, meaning people are already sharing and naturally linking to it (which is your goal, too).
Now, you just need to find an idea that works for your content.
Step 2: Know your audience and choose a topic for them.
Once you know your objective, it’s time to choose a topic that’s relevant to your target audience.
In particular, consider the needs of the site owners when you pitch your infographics. Put yourself in their shoes and imagine what they would find valuable in an infographic.
To go beyond the imaginary, check their websites to see if there are any existing infographics to give you an idea of what they like. If there aren’t, hang around their site for a while anyway and consume some of their content. This will also help you get a feel for their preferences, which can help you determine the types of infographics they like.
Beyond site owners, the needs of your target audience matter more (which will likely align with site owners’ needs since they’re in the same niche as you).
One way to brainstorm relevant topic ideas is to make use of Ahrefs, a popular SEO platform containing a suite of helpful tools.
Its Content Explorer tool lets you search the web for specific types of content, including infographics. Sticking with the guitar example from before, here’s what pops up when we search for ‘guitar infographic.’
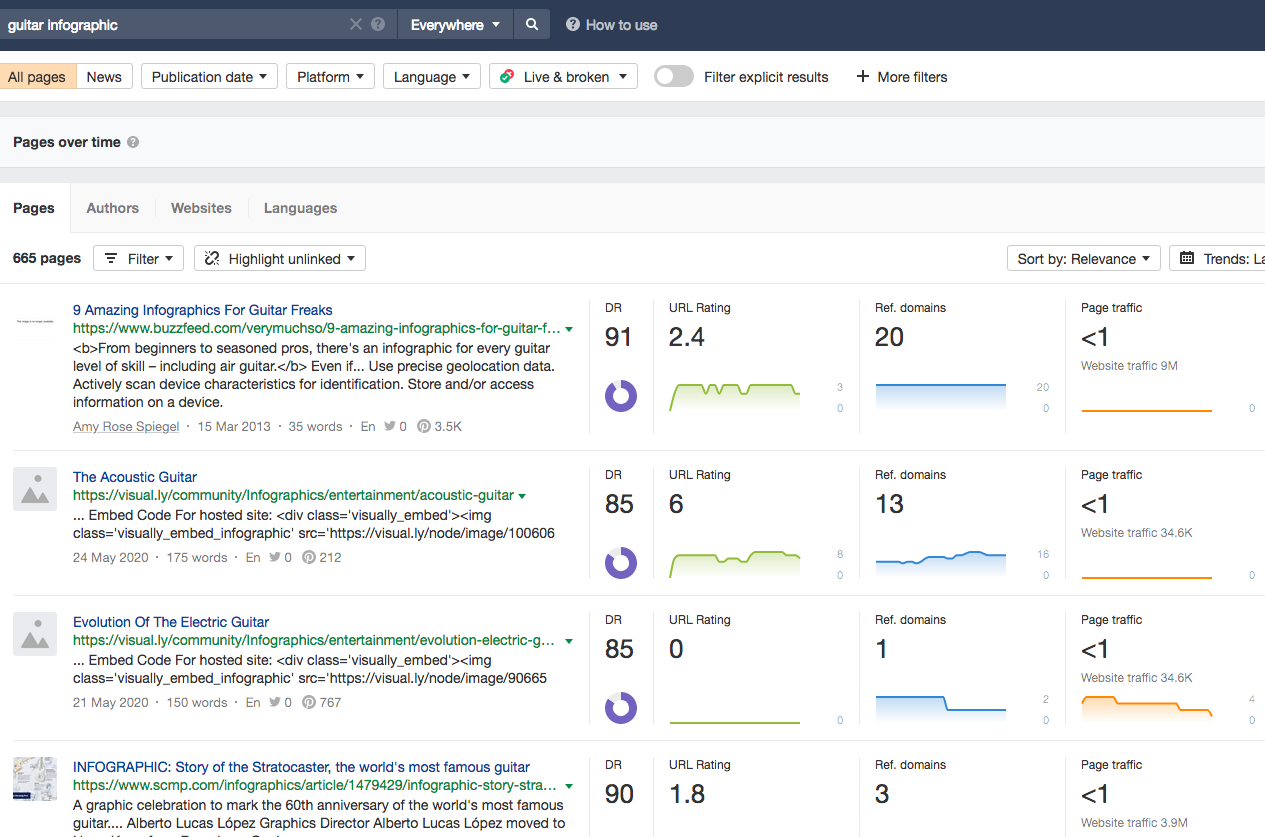
As you can see, the tool provides a list of guitar-based infographics, including useful metrics like their domain rating, referring domains, and page traffic.
Referring domains is an especially important metric here, as it lets you know how many websites are linking to the infographic. The first result, ‘9 Amazing Infographics for Guitar Freaks,’ has the highest number of referring domains, so it would be a great resource to review for ideas.
You can also filter the list for referring domains to only view infographics that generate lots of links.
Try to find four or five successful infographics to use for inspiration, both for topic ideas and layout.
Also, you can use Ahrefs or our free keyword planner tool to do keyword research. Ideally, your topic should center around a popular, trending search keyword to ensure you generate as much traffic as possible.
We usually merge two or three concepts into a single high-impact infographic to improve the effectiveness of link-building infographics. After all, the most successful infographic on the list above is the one that included 9 infographics into one post – so don’t limit yourself (without going overboard, either).
Consider what data types would be the most visually exciting and how you can communicate that information clearly and concisely.
- Do they need statistical data summarized?
- Do they need a comparison between the two methods of writing?
- Do they need a geographic map chart or an infographic for data visualization?
Step 3: Conduct research and gather data
Now that you have a topic, it’s time to start researching and gathering data.
Look for reliable sources of information and ensure that you are collecting accurate and relevant data for your topic.
Next, organize the information in a way that makes sense and is easy to understand. Ways you can do this include being sparse with text and using color schemes that are easy on the eyes.
Consider the visual elements you might want to use to communicate your data, such as graphs, charts, or maps.
This will help you to determine what kind of data you need to collect to create an effective infographic.
Craft a compelling story
The best infographics tell a story, whether it’s explicitly obvious or not. Here are some storytelling tips:
- Clear Narrative: What’s the central message you want to convey? Outline a logical flow that includes a beginning, middle, and end.
- Headline: Create a catchy, attention-grabbing headline that hints at the infographic’s value.
- Subheadings: Break down information into digestible chunks with clear subheadings.
Design your infographic
If you have access to an internal graphic designer, have them put together your infographics for you. We can’t stress enough the importance of sound design principles when creating infographics.
In other words, you’ll be much better off hiring a decorated freelance designer if you lack in-house resources than you would trying to create infographics with no experience.
If you do go the outsourcing route, you’ll need to develop a strong creative brief to ensure the designs you wind up with match your objectives. Here’s what goes into a solid brief:
- Clear Scope and Requirements: Communicate the project goals, audience, and expectations.
- Provide Key Data: Supply the thoroughly researched data points the infographic will visualize.
- Include Visual Inspiration: Share other infographics you like to guide the style.
- Emphasize Clarity: Stress the need for a clean, easy-to-read design.
Also, here are some key design elements to keep in mind when working with designers:
- Visual Hierarchy: Use contrasting font sizes, colors, and placement to guide the viewer’s eye through your information.
- Branding: Incorporate your brand’s color scheme and logo subtly.
- Charts & Graphs: Select the best chart types to visually represent your data (bar graphs, pie charts, line graphs, etc.).
- Icons & Illustrations: Enhance the visual appeal and help explain concepts quickly.
Here is a great example of a compelling infographic that’d be perfect for generating backlinks:
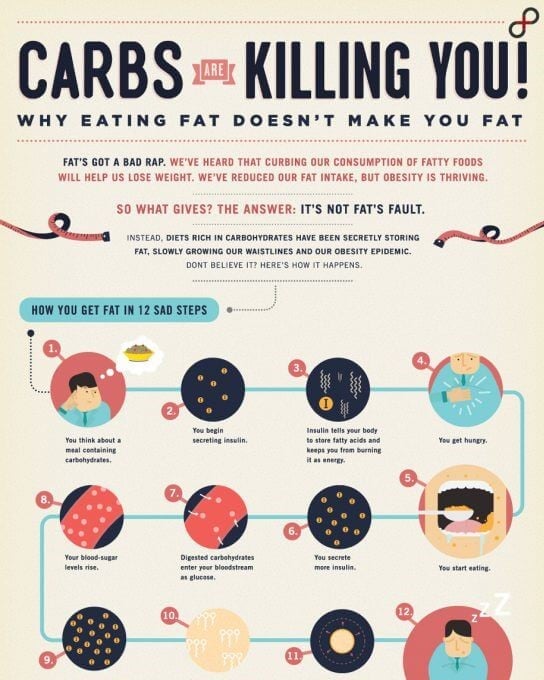
This infographic is concise, pleasant on the eyes, and very easy to follow. It flows from beginning to end, and it’s sparse with text.
Conversely, here’s an example of what NOT to do.
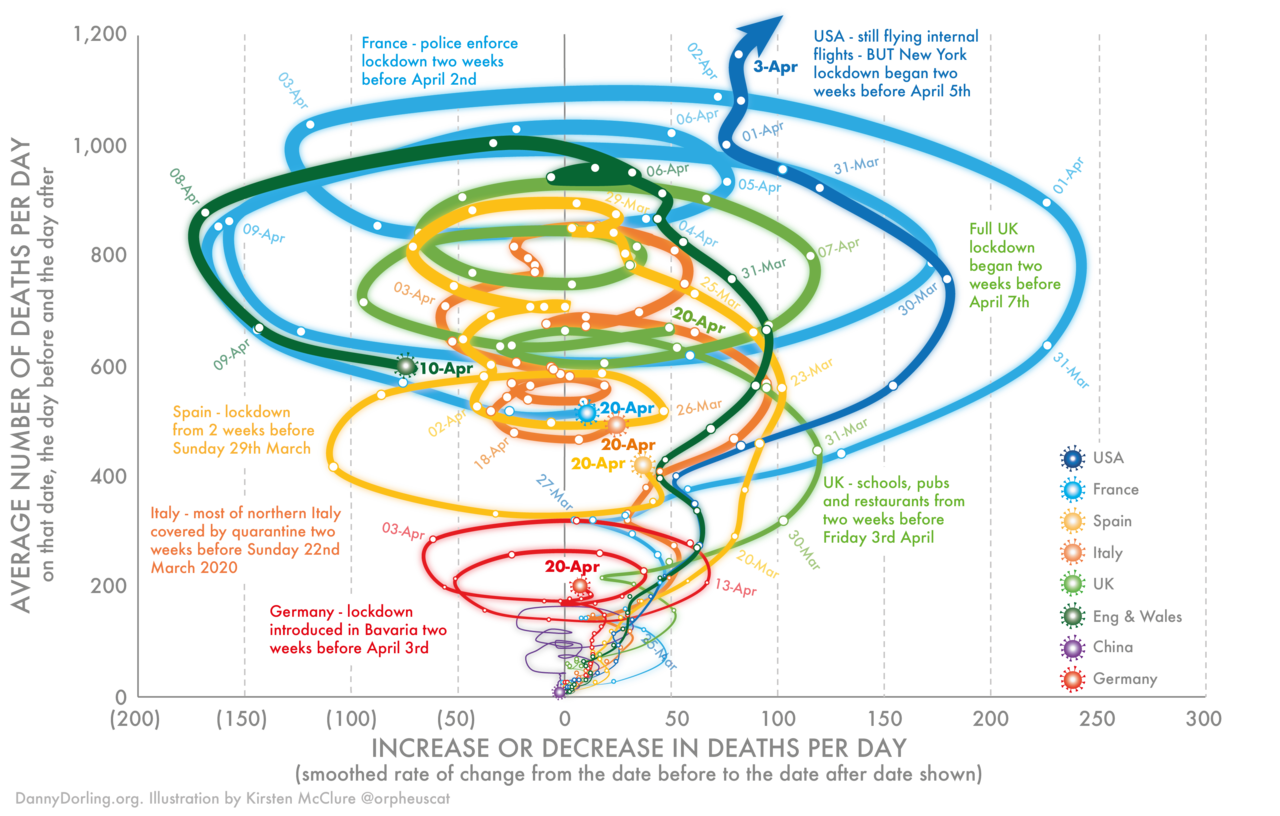
It’s far too cluttered and uses clashing color schemes, which makes it exceptionally difficult to read or make sense of.
For even more examples and ideas, check out this post.
Optimize your infographic for sharing
Once your design is complete, there’s only one step left – and that’s to make your infographic shareable for other websites. Here’s how to make it happen:
- Embeddable Code: Generate a code snippet that allows others to easily embed your infographic on their websites.
- Social Sharing: Include prominent social sharing buttons to encourage distribution.
- Mobile-friendly: Ensure the design adapts well to smaller screens.
How to Run an Effective Link Outreach Campaign Using Infographics
By now, you should have a solid grasp on how to create stellar infographics. Yet, if you want to use them to build links, we’ve only covered half the equation.
While you’re bound to generate some links without even trying, that’s not to say that you shouldn’t make efforts to promote your infographics.
Here’s what you’ll need to develop a true infographic link-building campaign.
Elements of an infographic link-building campaign
Most website owners get dozens if not hundreds of spammy outreach emails of either people asking for a backlink or trying to sell links from other sites that anyone can post on.

So, if you’re doing link-building outreach, you need to stand out in order to get people to open your email, let alone respond to it.
That’s where a strategic and calculated infographic link-building strategy can help.
A few of the techniques in this strategy include:
- Determine your topic and research other infographics used for link-building
- Design a unique and captivating graphic
- Post with a valuable piece of blog content
- Share the infographic on socials
- Share on infographic directories
- Reach out to relevant websites/bloggers and build a relationship
Also, in order to build links with infographics, you need to create a completely unique infographic that will motivate people to link to it naturally (i.e., without any encouragement on your part besides providing some embeddable code or a social share button).
For example, if you create a comparison infographic about how fresh, canned dog food is better, you should cite data points from studies that prove your point.
If that data has never been presented in a visual format like an infographic, you found a great opportunity to generate some juicy backlinks with a truly helpful piece of content.
Here’s a look at some other popular promotional methods for infographics.
Send to infographic directories
Online directories play a massive role in traditional link-building, and infographic link-building is no exception.
However, instead of uploading your business’s NAP (name, address, and phone number) to a directory like the Yellow Pages, you’ll focus on infographic directories and image-sharing sites like:
- Visual.ly
- Visualistan
- Slideshare
- Infographics Archives
- Infographic Journal
- Infographic Bee
- Graphs.net
- Flickr
- eLearning Infographics
- Cool Infographics
- Daily Infographic
- Behance
You never know when someone may come across one of your infographics on one of these sites and decide to link to it, which is why it’s worth submitting them.
Share your infographic on social media
Once you’ve created a great infographic, get it out there!
Don’t hesitate to upload it to all your social media channels, including Facebook, Twitter, and LinkedIn.
Reaching out to bloggers and influencers who have written about the same topic can also be effective. Give them a brief pitch on why they should link to your infographic.
Finally, don’t forget to link back to your website when sharing – as this will help drive traffic back to your site, which is great for SEO purposes, too!
Publish the infographic to your website
Releasing your infographic on your website is a great way to drive traffic and get quality content noticed.
Ensure it’s optimized for SEO by including keywords in the post title, URL, and content. Don’t keyword stuff; make it relevant and natural.
This will help make it easier for search engines to index your page, increasing the chances of appearing in relevant Google searches.
Reach out to relevant websites
Just creating the infographic and posting it won’t be enough to generate backlinks brimming with link juice.
You’ve got to do some dreaded outreach, but the fact that you have an infographic automatically makes it easier.
Start by looking for relevant influencers and bloggers who would find your infographic valuable.
Reaching out to other relevant websites can be a great way to get links back to your website. Look for websites related to your infographic’s topic and contact them about including it on their website.
Offer a short description of the infographic and explain why it would be beneficial for their audience, and provide them with an embed code or link back to your site.
Here are some outreach tips:
- Personalize. Take some time to peruse your prospect’s website and social media channels to get to know them. From there, heavily personalize the email to let them know that you’re familiar with and appreciate their content.
- Harp on the infographic’s value. The bottom line for any outreach email is “what will it do for the site owner?” Don’t waste time in bringing up the value your infographic will provide, such as simplifying a complicated process or teaching a new skill.
- Don’t get pushy. Hard sell tactics rarely work in the digital marketing/SEO world, so be chill. Focus on offering something of value instead of aggressively demanding a link.
Here’s a brief example of an infographic outreach email:
Hey (first name)
I just wanted to say I’m a big fan of (content piece) and the way you broke down (complicated topic). I’d been looking for guidance on the topic, and I greatly appreciate it.
I’m writing because I have a new infographic that covers (important topic). It teaches your audience the new skill/provides relevant statistics they’ve been dying to learn/know. I’m sure this infographic will provide a boost in traffic, and I would greatly appreciate a link.
(Share embed code).
Thanks,
(Your name)
Follow-up with prospects
Finally, don’t forget to follow up with prospects you’ve sent outreach emails or messages to.
Keeping them engaged is important as they may not have responded immediately but could be interested in a gentle reminder. A polite follow-up message can often be enough to secure a link back!
Using Ahrefs to find outreach targets
Here’s a step-by-step guide on how to use Ahrefs to find possible opportunities for a backlink outreach campaign.
- Use the “Content Explorer” tool to search for topics related to your infographic, such as “marketing recession trends.” This will give you a list of articles and websites about this topic.
- Look for websites relevant to your infographic and with a high DR or amount of traffic. These are potential targets for outreach that will help get some nice authoritative links.
- Create a list of potential targets and start contacting them with your infographic. Personalize your outreach emails and explain why your infographic is relevant and useful to their audience.
By following these steps, you can use Ahrefs to find potential opportunities for link outreach and increase the number of backlinks pointing to your website.
Infographics For Link-Building – A Summary
Creating infographics is one of the best ways to naturally generate backlinks and spice up your outreach efforts.
As stated before, this technique can boost your website’s traffic by 12%, which will help you convert more prospects and earn more revenue.
Creating an original infographic that’s visually appealing, informative, and entertaining will make your content stand out in a crowded marketplace.
In summary, an effective link-building strategy should include both organic and non-organic techniques to generate backlinks.
Organic techniques are used to gain naturally occurring links from other websites without manual outreach or link buying.
Non-organic techniques use manual outreach (asking) for backlinks from relevant websites or influencers.
Infographics represent a great opportunity for both organic and non-organic link-building strategies.
To ensure your infographic demands your audience’s attention, you have to create something interesting, unique, and engaging that people will want to share on social media platforms like Facebook, X, Instagram, and Pinterest.
This will help boost its visibility and increase the chances of gaining valuable backlinks.
Do you need help with your link-building campaign?
Our Link Outreach service will take over your outreach process, and HOTH X takes the entire process of your hands. Our team knows how to simplify your SEO success, so don’t wait to book a consultation today.

Very Nice and Informative Blog you have shared with us.